Stefanie Posavec’s data visualizations of literary texts


“First Chapters” by Stefanie Posavec. Qtd in “Distant Reading” by Scott Esposito. The Point 9: 2015, 183-93.
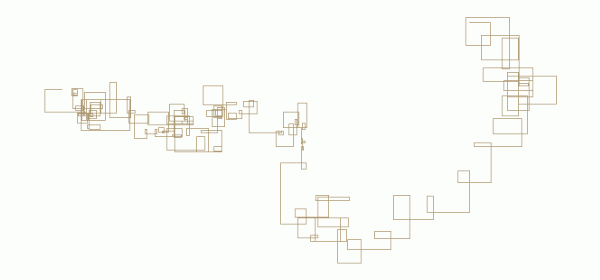
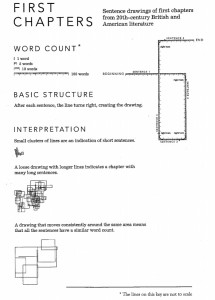
The featured image above is a map of the first chapter of The Great Gatsby, created by Stefanie Posavec as part of a series called First Chapters, in which she took the first chapters of a series of literary works and counted how many words were in each sentence, mapping the lengths of the sentences according to a very simple set of rules (see “First chapters“, to the right).
She has also mapped the first chapters of Cannery Row, A Room of One’s Own, Beloved, On the Road, and many more.
The analytical process is really simple and the tools necessary are so easy–any software that can plot a line of a certain length would work. And if you wanted to add another layer of complexity to the process, you could easily make lines different colors or use different line types (wavy lines, dotted lines, jagged lines, big thick lines, etc) to convey something about the sentences besides just length, say tone or style.
These mapping techniques would not work wholesale for the Fun Home projects that you all are working on; you probably wouldn’t get very far with mapping out sentence lengths given the visual nature of the graphic novel. However, can you think about ways that you might do something similar with graphic novels?
You might also check out some of the other types of literary maps that Posavec has produced. She created an iPhone app for Stephen Fry’s book that uses tags and a circular data visualization in order to allow readers to move in a nonlinear fashion through the book. She also created a data visualization of the lyrics of an OK Go album, which became the album’s cover and other artwork. She’s got lots of other similar cool work, which might spark ideas for you.

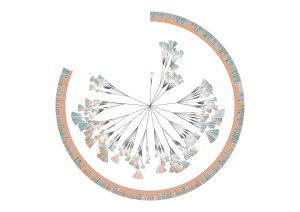
Detail from “(En)Tangled Word Bank by Stefanie Posavec and Greg McInerny.
The image to the left shows one of the series of data visualizations that Posavec and Greg McInery created epresenting the six editions of Charles Darwin’s The Origin of Species. The shapes represent every chapter of this edition of the book, and the color indicates whether that paragraph remained in the next edition of the book.
