Stefanie Posavec’s data visualizations of literary texts


Line drawing showing sentence lengths in first chapter of The Great Gatsby
EspositoOnMoretti_pdf

“First Chapters” by Stefanie Posavec. Qtd in “Distant Reading” by Scott Esposito. The Point 9: 2015, 183-93.

The featured image above is a map of the first chapter of The Great Gatsby, created by Stefanie Posavec as part of a series called First Chapters, in which she took the first chapters of a series of literary works and counted how many words were in each sentence, mapping the lengths of the sentences according to a very simple set of rules (see “First chapters“, to the right).

She has also mapped the first chapters of Cannery Row, A Room of One’s Own, Beloved, On the Road, and many more.

The analytical process is really simple and the tools necessary are so easy–any software that can plot a line of a certain length would work. And if you wanted to add another layer of complexity to the process, you could easily make lines different colors or use different line types (wavy lines, dotted lines, jagged lines, big thick lines, etc) to convey something about the sentences besides just length, say tone or style.

These mapping techniques would not work wholesale for the Fun Home projects that you all are working on; you probably wouldn’t get very far with mapping out sentence lengths given the visual nature of the graphic novel. However, can you think about ways that you might do something similar with graphic novels?

You might also check out some of the other types of literary maps that Posavec has produced. She created an iPhone app for Stephen Fry’s book that uses tags and a circular data visualization in order to allow readers to move in a nonlinear fashion through the book. She also created a data visualization of the lyrics of an OK Go album, which became the album’s cover and other artwork. She’s got lots of other similar cool work, which might spark ideas for you.
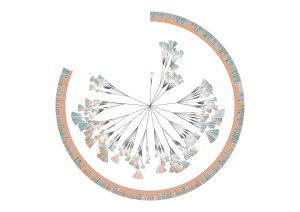
Detail from "(En)Tangled Word Bank by Stefanie Posavec and Greg McInerny, representing one of the six editions of Charles Darwin's The Origin of Species. The shapes represent every chapter of this edition of the book, and the color indicates whether that paragraph remained in the next edition of the book.

Detail from “(En)Tangled Word Bank by Stefanie Posavec and Greg McInerny.

The image to the left shows one of the series of data visualizations that Posavec and Greg McInery created epresenting the six editions of Charles Darwin’s The Origin of Species. The shapes represent every chapter of this edition of the book, and the color indicates whether that paragraph remained in the next edition of the book.
Two more resources that might be helpful for you

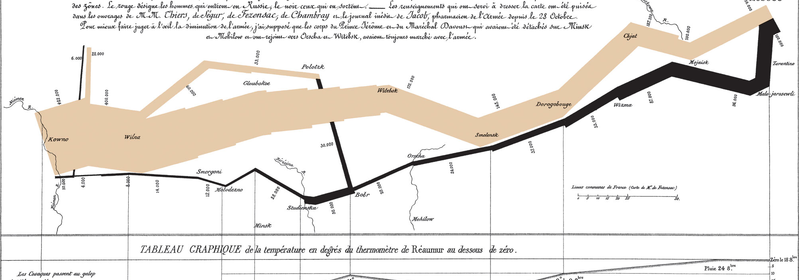
Data visualization of Charles Minard's flow chart of the Napoleonic War

Highcharts

Highcharts is an interactive JavaScript system for creating interactive data visualizations. It’s free for noncommercial use and allows you to embed your charts. I could imagine that some of these charts and graphs might be useful for you–one of these two types of heatmaps (heatmap 1, heatmap 2) or a treemap like this one might be a useful way for you to visualize your argument. You’ll have to work with Java code a little bit, but Highchart’s embedded editor makes it not too awfully complicated to play around.

Vida

Vida.io offers another set of JavaScript data visualization tools, including quite a few different options like Sankey diagrams (energy flow sankey diagrams and funnel flow sankey diagrams). Here are three posts to find out more about Sankey diagrams:

250 Best Movies as a Subway Map

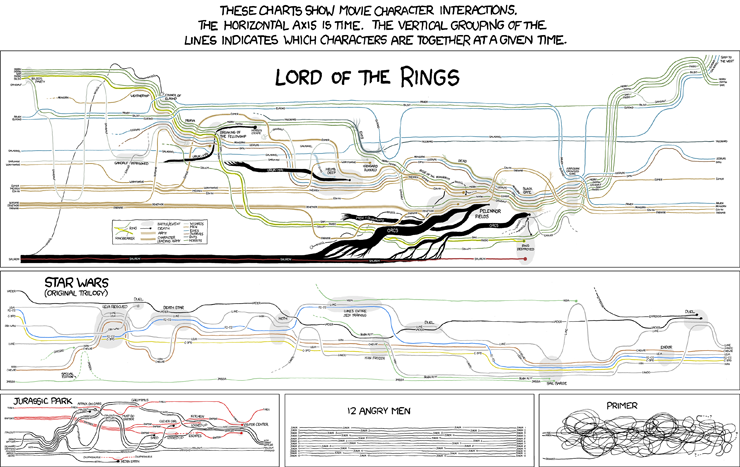
I can no longer find the original post at Vodkaster, but a few years ago they came out with their list of the 250 greatest movies of all time, but instead of just making a simple internet list, they produced a data visualization showing those movies in the format of a subway map. Here’s the map, which Miramax reposeted (click to embiggen):

Film genres are represented as lines: Romance, Comedy, Drama, Western, Sci-Fi, Fantasy, Animated, and so on. Movies that span multiple genres are represented as stations or nodes. Lines generally progress chronologically.

Think about how many different elements of information, and different types of relationships between information, are conveyed in this single image.

Looking ahead to the fourth week

photo of fireworks over Cinderella's castle at Disney World
4 2/2 Persepolis 135-172 (“The Shabbat” through “Tyrol”)
2/4 Persepolis 173-206 (“Pasta” through “The Horse”)
2/6 Writer/Designer chapter 3

This week we’ll be continuing our discussions of Persepolis on Monday and Wednesday. Be starting to think about which pages you’ll want to trace.

Remember that Cheryl Ball, one of the authors of Writer/Designer, will be on campus this week on Thursday and Friday (2/5 & 2/6) leading discussion and workshops for faculty and grad students around designing and assessing multimodal assignments. She’ll also give a public lecture on Thursday evening, starting at 6:00pm in the Jones Room on the 3rd floor of the library, entitled “The Asymptotic Relationship Between Digital Humanities and Computers and Writing.” I’ll offer extra credit to anyone who attends the lecture and then writes a paragraph or two on your blog about the event–summarize what she spoke about, what you learned, anything you found interesting about the talk. Ball is a very dynamic and fun speaker, and that title is meant to be at least a little bit puzzling and provocative, so you should consider attending if you can.

You do not need to publish a Sunday Funnies assignment this week. However, as we discussed in class Friday, you need to gather data that you’ll use for your personal infographic assignment next week. Track your daily schedule, noting throughout the day the times you spend on the following activities:

  • Sleep
  • Class
  • Study
  • Work
  • Exercise
  • Leisure
  • Other

The more detailed and accurate your notes are, the more you’ll have to work with when you go to visualize that data. You won’t need to show anyone your raw data unless you choose to do so, so for this week just keep as careful track of how you spend your time as you can.

So you can begin to get a sense of what you might do with this data, here are two examples of daily routines infographics:

(image credit: “Happy July 4th” by Flickr user Don Sullivan)