Two more resources that might be helpful for you
Highcharts
Highcharts is an interactive JavaScript system for creating interactive data visualizations. It’s free for noncommercial use and allows you to embed your charts. I could imagine that some of these charts and graphs might be useful for you–one of these two types of heatmaps (heatmap 1, heatmap 2) or a treemap like this one might be a useful way for you to visualize your argument. You’ll have to work with Java code a little bit, but Highchart’s embedded editor makes it not too awfully complicated to play around.
Vida
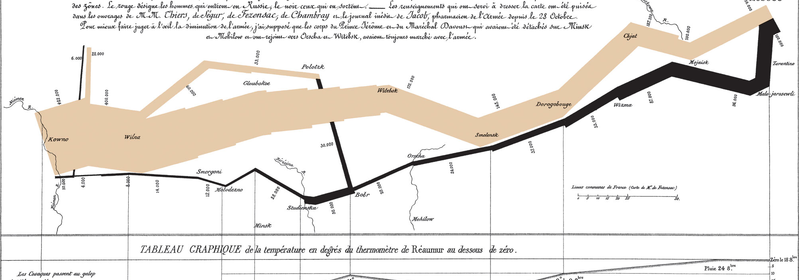
Vida.io offers another set of JavaScript data visualization tools, including quite a few different options like Sankey diagrams (energy flow sankey diagrams and funnel flow sankey diagrams). Here are three posts to find out more about Sankey diagrams:
- Best funnel visualizations
- Sankey diagrams from Excel
- Explanation of Sankey diagrams using D3 JavaScript tools (which Vidia.io uses)