Sunday Funnies 7: A Human Document

Photo 1

Click here to view this week’s assignment!

My revised poem:

Trying to reach the wish;                                                                                                    Luck was gone;                                                                                                                     Slowly;                                                                                                                                         No;                                                                                                                                                 It seemed unfair,                                                                                                               given up too much,                                                                                                                breaking into a mess,                                                                                                          everything seemed wrong                                                                                                no encouragement;                                                                                                              Too late.

Sunday Funny 7

Here is my seventh Sunday Funny. The pink shapes on the sides are supposed to be painkiller pills. Hope you like it!

No

they survived,

No,

all a dream,

falls

cracked her ribs

somebody to shoot

wide wound

painkillers,

light

scream.

eyes closed.

didn’t want to hear

img006

Speed Dating while Mapping

Gummi bears arranged in pairs as if speed dating

Preparation for class Friday

Remember, come to class tomorrow ready to talk for one minute about your plans for the mapping Fun Home project–have a draft of your elevator pitch ready to go. You will also need to be ready to listen to your classmates as they pitch their projects and to offer feedback to them. Please make sure to get to class on time, so that we can start and get in 8 rounds of dialog.

Bring your copy of Fun Home with you to class, along with any notes or sketches that you’ve made.

How this will work

Half the class will remain stationary while the other half will rotate seats every 6 minutes. At the start of each session, you and your partner will take turns talking for one minute about your plans. Listen carefully and take notes as your partner talks. Once you have each described the project you have in mind, you’ll have 4 minutes to give each other feedback and suggestions. When I call time, those of you who are rotating will each move one seat over and then and the process will repeat.

In the 50 minutes of class, we should be able to get in 8 rounds of 6-minute dialogs. You’ll have spoken one-on-one with half of the class about the projects, so by the end of the day Friday, you should have a broad overview of what your classmates are thinking about and you should have gotten a range of different responses and suggestions about what you are thinking about. Hopefully, you will leave class on Friday with a sense of empowerment as you come down the stretch on finishing the assignment.


(image credit: “blip_4: Speed Dating Jelly Babies” by Flickr user Michael Crane)

Stefanie Posavec’s data visualizations of literary texts

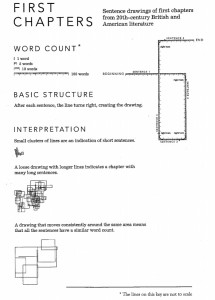
Line drawing showing sentence lengths in first chapter of The Great Gatsby
EspositoOnMoretti_pdf

“First Chapters” by Stefanie Posavec. Qtd in “Distant Reading” by Scott Esposito. The Point 9: 2015, 183-93.

The featured image above is a map of the first chapter of The Great Gatsby, created by Stefanie Posavec as part of a series called First Chapters, in which she took the first chapters of a series of literary works and counted how many words were in each sentence, mapping the lengths of the sentences according to a very simple set of rules (see “First chapters“, to the right).

She has also mapped the first chapters of Cannery Row, A Room of One’s Own, Beloved, On the Road, and many more.

The analytical process is really simple and the tools necessary are so easy–any software that can plot a line of a certain length would work. And if you wanted to add another layer of complexity to the process, you could easily make lines different colors or use different line types (wavy lines, dotted lines, jagged lines, big thick lines, etc) to convey something about the sentences besides just length, say tone or style.

These mapping techniques would not work wholesale for the Fun Home projects that you all are working on; you probably wouldn’t get very far with mapping out sentence lengths given the visual nature of the graphic novel. However, can you think about ways that you might do something similar with graphic novels?

You might also check out some of the other types of literary maps that Posavec has produced. She created an iPhone app for Stephen Fry’s book that uses tags and a circular data visualization in order to allow readers to move in a nonlinear fashion through the book. She also created a data visualization of the lyrics of an OK Go album, which became the album’s cover and other artwork. She’s got lots of other similar cool work, which might spark ideas for you.

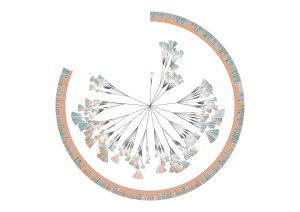
Detail from "(En)Tangled Word Bank by Stefanie Posavec and Greg McInerny, representing one of the six editions of Charles Darwin's The Origin of Species. The shapes represent every chapter of this edition of the book, and the color indicates whether that paragraph remained in the next edition of the book.

Detail from “(En)Tangled Word Bank by Stefanie Posavec and Greg McInerny.

The image to the left shows one of the series of data visualizations that Posavec and Greg McInery created epresenting the six editions of Charles Darwin’s The Origin of Species. The shapes represent every chapter of this edition of the book, and the color indicates whether that paragraph remained in the next edition of the book.

Sunday Funnies 7: A Human Document

IMG_8734


I used a page from Daniel Quinn’s Ishmael and created my own poem.

My poem:

the sound of the talking was nothing

then something changed

imagine the presence of one

speech occurred over and over

my attention possessed;

now I employed a different sound;

by small steps,

in some mysterious way,

I was truly born

as a person.

Click here to view the assignment.

Two more resources that might be helpful for you

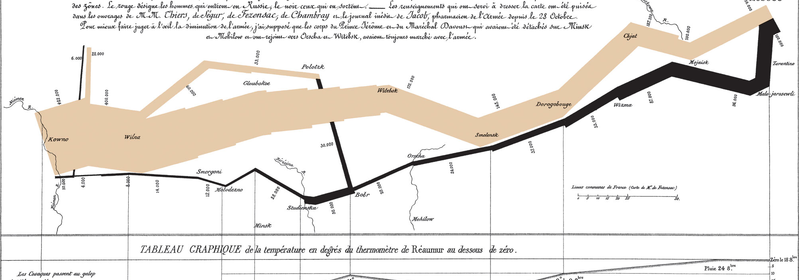
Data visualization of Charles Minard's flow chart of the Napoleonic War

Highcharts

Highcharts is an interactive JavaScript system for creating interactive data visualizations. It’s free for noncommercial use and allows you to embed your charts. I could imagine that some of these charts and graphs might be useful for you–one of these two types of heatmaps (heatmap 1, heatmap 2) or a treemap like this one might be a useful way for you to visualize your argument. You’ll have to work with Java code a little bit, but Highchart’s embedded editor makes it not too awfully complicated to play around.

Vida

Vida.io offers another set of JavaScript data visualization tools, including quite a few different options like Sankey diagrams (energy flow sankey diagrams and funnel flow sankey diagrams). Here are three posts to find out more about Sankey diagrams:

250 Best Movies as a Subway Map

I can no longer find the original post at Vodkaster, but a few years ago they came out with their list of the 250 greatest movies of all time, but instead of just making a simple internet list, they produced a data visualization showing those movies in the format of a subway map. Here’s the map, which Miramax reposeted (click to embiggen):

Film genres are represented as lines: Romance, Comedy, Drama, Western, Sci-Fi, Fantasy, Animated, and so on. Movies that span multiple genres are represented as stations or nodes. Lines generally progress chronologically.

Think about how many different elements of information, and different types of relationships between information, are conveyed in this single image.

1 9 10 11 12 13 34