Sunday Funnies 3: Visual Note Taking

After taking visual notes in my Astronomy class, I can definitely say that I better understand the material. I’ve always been a visual learner, and after looking through the pictures that I drew, the concepts became clearer than before. The pictures were especially helpful with learning the phases of the moon. When just describing where the Moon is in regards to the Earth and Sun, it is hard to distinguish which phase is occurring at a certain time of day. When viewing a drawing of the Moon in between the Earth and the Sun, it’s clear that the Moon is at the New Moon phase. I found it interesting how much easier it was to understand certain content when drawing it.

Sunday Funny# 3


Sunday Funny #3

Sunday Funny #3

Taking visual notes was an extremely challenging experience for me. When I first saw the examples I hoped to create a similar result, however, after 6 drafts I realized that my drawing skills were those of a six years old. I decided to use this opportunity to study the concept of logical fallacies, which we learned last week in my psychology class. Despite the difficulty of this assignment, I now understand the fallacies better and I was able to understand the relationship as well as the differences between them.
When I was creating the visual notes, the most challenging part of the process (besides the drawing itself) was to make a cohesive picture. At first I began to create small drawings at the corners of the page. However, I wanted to find a way to connect those drawings, in a way that made sense both conceptually, and visually. Therefore I decided to take on several themes instead of a bunch of independent drawings. I used the importance of school, the need for food and several philosophical ideas as the mean themes of my visual notes. The use of arrows also proved extremely efficient when connecting ideas. Another challenging part of this assignment was trying to stay away from creating a comic “book”. In several occasions I leaned towards expressing a concept using conversations between characters. However, at the end of the process, I understood the notes that I had taken in a distinct way, instead of words in my head, when approaching the concept of fallacies, I now see images, which makes it easier to understand such an abstract topic.

To see other visual notes click here.


Sunday Funny 3: Visual Notes

sunday funny 3

I decided to explore the visual note taking skill using my Chem 142 notes. The hard part about this assignment was figuring out which class would this be the most useful. I have a test coming up in chemistry and using this skill I was able to grasp the concept of phase changes and intermolecular forces vs intramolecular forces better. I combined the concepts together through the use of pictures and diagrams. Even though I have never used this note taking skill it help me study better. I will definitely consider using this method more often especially in chemistry.

I used a mixture of words and pictures for my notes because on test I would have to explain for example what constitutes a hydrogen intermolecular force etc. While transferring that idea to pictures, it is really important in chemistry to be able to explain what is actually happening. So after drawing the pictures of the phase diagrams and the different intermolecular forces, I included key ideas to tie the two concepts together and quizzed myself by identifying the pictures with the corresponding explanations of the intermolecular forces.

Sunday Funnies 3: Visual Note Taking

IMG_1420

I hardly ever take visual notes, but after this assignment I might do it more frequently. I made these notes for my Chemistry 142 class. Most people don’t think science and drawing go together but after making these visual notes, I think they do. Many concepts in science can be explained with visuals. This assignment was more difficult than I thought it would be. Most of the things we learn in chemistry are done by reading or just doing problems. Taking concepts from the reading and making them into visuals actually helped me grasp a better understanding of them. I believe I will think about concepts, not just in chemistry but other classes as well, in a more visual manner. It makes you think in a different manner and truly understand what you’re learning. Moving away from reading and just doing problems to learn was pretty interesting and to be honest, somewhat refreshing.

Looking ahead to the fourth week

photo of fireworks over Cinderella's castle at Disney World
4 2/2 Persepolis 135-172 (“The Shabbat” through “Tyrol”)
2/4 Persepolis 173-206 (“Pasta” through “The Horse”)
2/6 Writer/Designer chapter 3

This week we’ll be continuing our discussions of Persepolis on Monday and Wednesday. Be starting to think about which pages you’ll want to trace.

Remember that Cheryl Ball, one of the authors of Writer/Designer, will be on campus this week on Thursday and Friday (2/5 & 2/6) leading discussion and workshops for faculty and grad students around designing and assessing multimodal assignments. She’ll also give a public lecture on Thursday evening, starting at 6:00pm in the Jones Room on the 3rd floor of the library, entitled “The Asymptotic Relationship Between Digital Humanities and Computers and Writing.” I’ll offer extra credit to anyone who attends the lecture and then writes a paragraph or two on your blog about the event–summarize what she spoke about, what you learned, anything you found interesting about the talk. Ball is a very dynamic and fun speaker, and that title is meant to be at least a little bit puzzling and provocative, so you should consider attending if you can.

You do not need to publish a Sunday Funnies assignment this week. However, as we discussed in class Friday, you need to gather data that you’ll use for your personal infographic assignment next week. Track your daily schedule, noting throughout the day the times you spend on the following activities:

  • Sleep
  • Class
  • Study
  • Work
  • Exercise
  • Leisure
  • Other

The more detailed and accurate your notes are, the more you’ll have to work with when you go to visualize that data. You won’t need to show anyone your raw data unless you choose to do so, so for this week just keep as careful track of how you spend your time as you can.

So you can begin to get a sense of what you might do with this data, here are two examples of daily routines infographics:

(image credit: “Happy July 4th” by Flickr user Don Sullivan)

A Visual Look at my Polisci Methods Class

I really enjoyed this Sunday Funnies segment but it wasn’t as easy as I imagined it would be. I’m not the most experienced artist but I find it funny how my scribbly cursive translates into such comical cartoons. The material was pretty straightforward so I won’t say it exactly helped me understand the lecture differently. I also wouldn’t say that I would do this in class, because it takes a lot of time to get the doodles– crude as they are– to my liking. Something I noticed was that most of the characters I drew were male, to my chagrin. I think I drew them male mostly because I just can’t doodle hair well, so I would avoid drawing women with beautiful, wispy hair. So anyway, I enjoyed my time with this assignment, so thank you Professor! Here’s a link back to his site where you can view our original project here. Enjoy! Sunday Funnies visual drawing 1Sunday Funnies visual drawing 2

Another example of visual notes

View of a complex flow chart

I was thinking some more about the visual notes you’re all producing this weekend. I linked you to the example of Giulia Forsyth, which I think is an especially provocative and interesting one for you. I thought you might also be interested in a different sort of visual notes, too.

My partner is in law school now. She went to a pretty conservative undergrad institution and took very traditional textual notes in all her classes, though she was also always a doodler and is a visual thinker. After graduation, she worked in higher education administration and got into database development, mostly using Filemaker Pro, which uses a visual organization system to organize the relationships between elements of databases and she found it a really powerful method of learning and synthesizing other information. And I kept pointing her to crazy visual notes stuff that I’m interested in too.
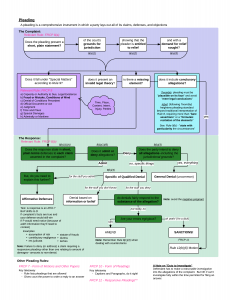
Pleading - Response-Complaint General diagram

“Pleading, Complaint, Response General Diagram” flowchart

Now that she’s in law school, she’s found creating diagrams and other visual notes to be incredibly useful as a method of studying for her law school exams. As a class finishes a unit, she’ll synthesize the material from that unit using Lucidchart. It takes her more time than just recopying her notes, as many of her classmates do, but she’s found that she understands the material more deeply and remembers the important concepts more clearly. At the end of the semester, when she’s reviewing for an exam, she finds it to be much more efficient to study the diagrams she’s made than to go through many pages of written notes.

She offered that I could post a couple of her diagrams here, mostly by way of showing an alternate version of creating visual notes, especially visual notes that don’t require drawing skill.

(Other mind mapping tools.)

Visual Note Taking

Sunday Funnies 3

Sunday Funnies 3: Visual Note Taking

I did my visual note taking for chemistry 142. In class we talked about things such as unit cells, lattice points, and phase diagrams. I tried to the best of my not-so-artistic ability to give representations of each of these. I used chemistry because a visual diagram is very useful in chemistry. Transferring my thoughts into pictures really helped me gain a better understanding of unit cells and lattice points. This is the first time I have used visual note taking, but I believe I will use it frequently in the future.

The graph in the top left below “chem 142″ is a phase diagram. Instead of writing in each space “solid, liquid, gas” respectively, I decided to draw how the molecules appear in each phase. Directly to the right of the phase diagram is a three dimensional sketch of a unit cell. It has a lattice point in the corners and makes up a total of one atom. Below the phase diagram and unit cell is the formula used to calculate the volume of the unit cell. Because the atoms are spheres it is the formula for the volume of a sphere. I played on the name pi and drew a picture of a pie.


,Greer Howard

Sunday Funnies 3: Visual Note Taking

FullSizeRender (1)

It really helped me highlight the key points and allowed me to put all the main topics together. This allowed me to really focus on the key ideas and I didn’t have to be so overwhelmed with all the little details in my handwritten notes from class. By adding images, it drew my attention and really helped me retain information better. I feel like images, at times, can really convey a message better than words can. In this case, images allow me to link all the information from lectures together that words aren’t able to do (or can’t do as easily).

This alternative note-taking strategy made me realize how the information I learned in class all fits together. I’ve realized that I’m a really visual learner and that looking at pictures can allow me to recall information more. I found it pretty enjoyable to doodle around and was interestingly very relaxing. Although, the drawings took a lot longer than I expected, since I’m not a very artistic person. I also found it interesting how I was able to bring my notes together to a few main points to focus on because when I looked over my lecture notes I felt like there were many more topics that were covered. I find it really amusing how such a simple idea can really allow for me to retain information more efficiently and thus, increasing my knowledge in a particular subject.

Sunday Funnies 3: Visual Note Taking

IMG_20150129_0002 IMG_20150129_0001

I decided to take visual notes  for two classes this week.  Neither class covered that much content, so I did not find it particularly challenging to capture the essence of either class in one page of visual notes. In the first class, Health 200, we discussed the different roles a PHP takes when leading a class.  The second, Anthropology 101, we discussed Charles Darwin and his discovers.

The process of visual note taking itself was actually very enjoyable. I found myself struggling (in a good way) with the material in a way I have never done before. I was forced to not only understand and visualize the material in my head, but I had to put those thoughts into presentable drawings. It is one thing to take traditional notes, often a tedious task of copying down what is on the board and the important additions of what comes out of your professors mouth. Visual notes on the other hand force you to capture both aspects of note taking, while also limiting your word usage and representing them through a new and fun medium. I am not sure I can see myself using visual notes a lot in my future, but I can definitely see it being a better use of my time rather than aimlessly doodling in class!

1 26 27 28 29 30 34