Down the Graphic Novel Rabbit Hole

A friend of mine, who teaches a senior-level course on comics and graphic novels at Georgia State, was at the ELI conference with me this week and showed me a video one of his students made comparing comics and film:

Down the Graphic Novel Rabbit Hole We Go” by Andrew Lee:

This video is grounded in a response to a few pages from Scott McCloud‘s Understanding Comics, wherein McCloud grapples with the initial difficulty of even deciding exactly what we mean when we call something a “comic” or “sequential art.” Here are those few pages from the first chapter of the book:

Visual Notes from My Conference Session

Derek Bruff attended the panel where my colleagues and I presented about Domain of One’s Own at Educause Learning Initiative and posted these sketchnotes about the session to Twitter. As far as I can tell, he took them in real time while we spoke and he captured the essence of what we talked about. As you can see, there’s a fair amount of text still, but with just a little bit of doodling and diagramming, he’s sketched out relationships and concepts instead of writing out lots of words.

I retweeted the heck out of this image, to be honest. Being able to give people a sense of our entire panel in a single image is a real gift Derek offered to us by tweeting it out.

Live Blogging Persepolis

This week, while you watch Persepolis I’d like you to post brief observations and responses to your blogs. If you have a specific idea for how you want to do this, you are free to choose your own strategies, but for the sake of providing guidance to those of you new to the idea of liveblogging, here’s my suggestion for how to proceed.

Create a post on your site that lets readers know that you’ll be posting responses to the movie. This can be a really short paragraph. Tag that post as “liveblogging Persepolis” so that you can pull them up as a group. As you watch the movie, pause it periodically and post your own comments to that post. If you can, include time cues for where you are in the move when you post. Post whatever comes to mind as you watch the film–compare it to the book or note anything of interest. Feel free to comment in reply to each other too or to link to other students’ comments.

We’ll begin class on Friday by looking at your liveblogging posts, probably using a tool called Storify.


Looking ahead to the fourth week

photo of fireworks over Cinderella's castle at Disney World
4 2/2 Persepolis 135-172 (“The Shabbat” through “Tyrol”)
2/4 Persepolis 173-206 (“Pasta” through “The Horse”)
2/6 Writer/Designer chapter 3

This week we’ll be continuing our discussions of Persepolis on Monday and Wednesday. Be starting to think about which pages you’ll want to trace.

Remember that Cheryl Ball, one of the authors of Writer/Designer, will be on campus this week on Thursday and Friday (2/5 & 2/6) leading discussion and workshops for faculty and grad students around designing and assessing multimodal assignments. She’ll also give a public lecture on Thursday evening, starting at 6:00pm in the Jones Room on the 3rd floor of the library, entitled “The Asymptotic Relationship Between Digital Humanities and Computers and Writing.” I’ll offer extra credit to anyone who attends the lecture and then writes a paragraph or two on your blog about the event–summarize what she spoke about, what you learned, anything you found interesting about the talk. Ball is a very dynamic and fun speaker, and that title is meant to be at least a little bit puzzling and provocative, so you should consider attending if you can.

You do not need to publish a Sunday Funnies assignment this week. However, as we discussed in class Friday, you need to gather data that you’ll use for your personal infographic assignment next week. Track your daily schedule, noting throughout the day the times you spend on the following activities:

  • Sleep
  • Class
  • Study
  • Work
  • Exercise
  • Leisure
  • Other

The more detailed and accurate your notes are, the more you’ll have to work with when you go to visualize that data. You won’t need to show anyone your raw data unless you choose to do so, so for this week just keep as careful track of how you spend your time as you can.

So you can begin to get a sense of what you might do with this data, here are two examples of daily routines infographics:

(image credit: “Happy July 4th” by Flickr user Don Sullivan)

Another example of visual notes

View of a complex flow chart

I was thinking some more about the visual notes you’re all producing this weekend. I linked you to the example of Giulia Forsyth, which I think is an especially provocative and interesting one for you. I thought you might also be interested in a different sort of visual notes, too.

My partner is in law school now. She went to a pretty conservative undergrad institution and took very traditional textual notes in all her classes, though she was also always a doodler and is a visual thinker. After graduation, she worked in higher education administration and got into database development, mostly using Filemaker Pro, which uses a visual organization system to organize the relationships between elements of databases and she found it a really powerful method of learning and synthesizing other information. And I kept pointing her to crazy visual notes stuff that I’m interested in too.

Pleading - Response-Complaint General diagram

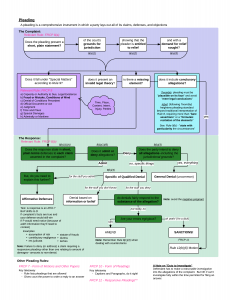
“Pleading, Complaint, Response General Diagram” flowchart

Now that she’s in law school, she’s found creating diagrams and other visual notes to be incredibly useful as a method of studying for her law school exams. As a class finishes a unit, she’ll synthesize the material from that unit using Lucidchart. It takes her more time than just recopying her notes, as many of her classmates do, but she’s found that she understands the material more deeply and remembers the important concepts more clearly. At the end of the semester, when she’s reviewing for an exam, she finds it to be much more efficient to study the diagrams she’s made than to go through many pages of written notes.

She offered that I could post a couple of her diagrams here, mostly by way of showing an alternate version of creating visual notes, especially visual notes that don’t require drawing skill.

(Other mind mapping tools.)

Announcing drop-in studio hour

Starting this week, the Domain team will be hosting a studio drop-in hour for students working on web projects.

When: Fridays, 10-11am (immediately after our class)


Where: Callaway N203 (immediately next door to our classroom)

The idea for this hour is not so much that you come in and ask questions instead of going to the Writing Center, but that you can stop in, use the computers in the room to work individually or collaboratively with your group, and there will be someone staffing that hour who can help out with questions as they come up.

At least one of the people staffing that hour will be me on most weeks.

Which means I’ll need to adjust my scheduled office hours. I think going forward, I’ll have office hours on Wednesdays instead of Fridays, but I’m not 100% certain of that time yet.

1 2 3 4 5