Sunday Funnies 4: Daily Routine Infographic

Screenshot of Google image search for "best infographic makers"

Due: 2/15

Last week, you tracked your daily schedule using the 7 categories we agreed upon as a class. Now it’s time for you to turn that data into an inforgaphic. There are lots of programs that you can use to create infographics. I’ll recommend that you use Infogram mostly because it works from either their built-in spreadsheet system or you can upload your data from files you’ve got.

If you can manage to create a visualization like Podio’s Daily Routines of Creative People that not only shows how much time you spent on each activity but at what time in the day, then that will be great. However, for the sake of simplicity it will be enough if all you report is how many hours you spend on each activity each day for the week. You can choose whichever type of charts you think works best.

You can only save your infographic as a JPG if you upgrade to the paid version of Infogram. However, you can embed your work easily. Once you’re finished making your chart, just click on the Share button at the top of the page, then copy the embed code in the dialog box. Then log in to your site’s dashboard and create a new post. On the top right corner of your text editor, switch from Visual to Text and then paste your code in.

Here’s a link to the Infogram help pages.

(image credit: screenshot of Google image search for “Best Infographic makers“)

Live Blogging Persepolis

This week, while you watch Persepolis I’d like you to post brief observations and responses to your blogs. If you have a specific idea for how you want to do this, you are free to choose your own strategies, but for the sake of providing guidance to those of you new to the idea of liveblogging, here’s my suggestion for how to proceed.

Create a post on your site that lets readers know that you’ll be posting responses to the movie. This can be a really short paragraph. Tag that post as “liveblogging Persepolis” so that you can pull them up as a group. As you watch the movie, pause it periodically and post your own comments to that post. If you can, include time cues for where you are in the move when you post. Post whatever comes to mind as you watch the film–compare it to the book or note anything of interest. Feel free to comment in reply to each other too or to link to other students’ comments.

We’ll begin class on Friday by looking at your liveblogging posts, probably using a tool called Storify.


Looking ahead to the fourth week

photo of fireworks over Cinderella's castle at Disney World
4 2/2 Persepolis 135-172 (“The Shabbat” through “Tyrol”)
2/4 Persepolis 173-206 (“Pasta” through “The Horse”)
2/6 Writer/Designer chapter 3

This week we’ll be continuing our discussions of Persepolis on Monday and Wednesday. Be starting to think about which pages you’ll want to trace.

Remember that Cheryl Ball, one of the authors of Writer/Designer, will be on campus this week on Thursday and Friday (2/5 & 2/6) leading discussion and workshops for faculty and grad students around designing and assessing multimodal assignments. She’ll also give a public lecture on Thursday evening, starting at 6:00pm in the Jones Room on the 3rd floor of the library, entitled “The Asymptotic Relationship Between Digital Humanities and Computers and Writing.” I’ll offer extra credit to anyone who attends the lecture and then writes a paragraph or two on your blog about the event–summarize what she spoke about, what you learned, anything you found interesting about the talk. Ball is a very dynamic and fun speaker, and that title is meant to be at least a little bit puzzling and provocative, so you should consider attending if you can.

You do not need to publish a Sunday Funnies assignment this week. However, as we discussed in class Friday, you need to gather data that you’ll use for your personal infographic assignment next week. Track your daily schedule, noting throughout the day the times you spend on the following activities:

  • Sleep
  • Class
  • Study
  • Work
  • Exercise
  • Leisure
  • Other

The more detailed and accurate your notes are, the more you’ll have to work with when you go to visualize that data. You won’t need to show anyone your raw data unless you choose to do so, so for this week just keep as careful track of how you spend your time as you can.

So you can begin to get a sense of what you might do with this data, here are two examples of daily routines infographics:

(image credit: “Happy July 4th” by Flickr user Don Sullivan)

Another example of visual notes

View of a complex flow chart

I was thinking some more about the visual notes you’re all producing this weekend. I linked you to the example of Giulia Forsyth, which I think is an especially provocative and interesting one for you. I thought you might also be interested in a different sort of visual notes, too.

My partner is in law school now. She went to a pretty conservative undergrad institution and took very traditional textual notes in all her classes, though she was also always a doodler and is a visual thinker. After graduation, she worked in higher education administration and got into database development, mostly using Filemaker Pro, which uses a visual organization system to organize the relationships between elements of databases and she found it a really powerful method of learning and synthesizing other information. And I kept pointing her to crazy visual notes stuff that I’m interested in too.

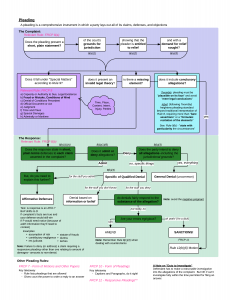
Pleading - Response-Complaint General diagram

“Pleading, Complaint, Response General Diagram” flowchart

Now that she’s in law school, she’s found creating diagrams and other visual notes to be incredibly useful as a method of studying for her law school exams. As a class finishes a unit, she’ll synthesize the material from that unit using Lucidchart. It takes her more time than just recopying her notes, as many of her classmates do, but she’s found that she understands the material more deeply and remembers the important concepts more clearly. At the end of the semester, when she’s reviewing for an exam, she finds it to be much more efficient to study the diagrams she’s made than to go through many pages of written notes.

She offered that I could post a couple of her diagrams here, mostly by way of showing an alternate version of creating visual notes, especially visual notes that don’t require drawing skill.

(Other mind mapping tools.)

Announcing drop-in studio hour

Starting this week, the Domain team will be hosting a studio drop-in hour for students working on web projects.

When: Fridays, 10-11am (immediately after our class)


Where: Callaway N203 (immediately next door to our classroom)

The idea for this hour is not so much that you come in and ask questions instead of going to the Writing Center, but that you can stop in, use the computers in the room to work individually or collaboratively with your group, and there will be someone staffing that hour who can help out with questions as they come up.

At least one of the people staffing that hour will be me on most weeks.

Which means I’ll need to adjust my scheduled office hours. I think going forward, I’ll have office hours on Wednesdays instead of Fridays, but I’m not 100% certain of that time yet.

“If you’re interested in the model of education, you don’t start from a production line mentality”

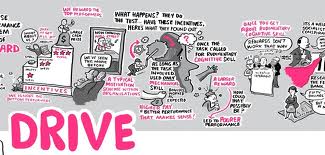
Screen cap of Dan Pink's RSA drawing

I mentioned in class today RSA Animate, which is produced by The Royal Society for the encouragement of Arts, Manufactures and Commerce is an “enlightenment organisation committed to finding innovative and creative practical solutions to today’s social challenges [by …] empowering people to be active participants in creating a better world.” Since 1754, RSA has sponsored various sorts of events intended to further this goal, including public lectures, talks, debates, and screenings. The organization developed the idea of an animation series in order to allow these events to reach a much broader audience. A team of fellows at RSA selects lectures, edits down the audio to about 10 minutes, and then sends them to an animator named Andrew Park at Cognitive Media to be turned into animated video.

Here are two of my favorites from RSA Animates:


In “Changing Education Paradigms,” Sir Ken Robinson critiques our educational system for being “modelled on the interests of industrialism and [designed] in the image
of it.” He calls, instead, for an educational system that strives to help students achieve an aesthetic experience, where their “senses are operating at their peak, [they’re] present in the current moment, [they’re] resonating with the excitement of this thing that [they’re] experiencing, [they’re] fully alive.” Such a system, he argues, will value divergent thinking and collaboration.


Dan Pink, in “Drive: The surprising truth about what motivates us,” argues that the traditional model of incentivizing work (reward desired behavior and you get more of it) only works when that work is strictly mechanical; as long as tasks require even rudimentary cognitive skills, that reward system not only fails to incentivize work but actually leads to poorer performance. Pink proposes instead that, once employees are paid enough to meet their basic needs, there are 3 factors that lead to better performance as well as personal satisfaction: autonomy, mastery, and performance.

Pages and/vs. Blog Posts

A photograph of a book with post it flags stuck in its pages.

In this class, I make a clear distinction between blog posts and pages: all of your major, formal projects will go onto your sites as pages. The Sunday Funnies assignments and all of the other shorter, low-stakes, reflective writing that you do will go onto your sites as blog posts. Pages can be edited just as posts can be, but in general they are meant to serve as static, completed, more or less self-contained pieces of writing. Blogs are meant to go up onto the posts page in descending chronological order, so built into the function of a blog is that you write something and publish it, then if you have more to say on the subject or want to revise what you wrote in a major way, you do so by just writing a new blog post rather than going back to the original and restructuring it.

Here’s another clear distinction between posts and pages: posts syndicate but pages do not (because syndication is predicated on the idea of a frequently updating and changing posts page–static pages don’t need to syndicate because, well, they are more or less static). We are relying on syndication to the course site as the means of collecting all of the work that you do on your sites into a central location, but if your major projects go onto pages and pages don’t syndicate then how will they be included? When you complete one of the major assignments, you will write a blog post, linking to the landing page for the assignment. I’ll generally ask you to write something reflective about the work that you’ve done in those blog posts. Sometimes I might ask that you provide a summary or abstract of the argument, perhaps framing the post as an announcement meant to entice readers to check out what you’ve done akin to a teaser in journalism.

One last point: for the purposes of this class, at least, all blog posts and all pages should be multimodal and should include multiple media. You should not publish a page or a post that is composed entirely of text.

faq

(image credit: “231 by Flickr user Jay Peg)

Week 3

the number 3 in different fonts as a collage
3 1/26 Persepolis 33-102 (“The Letter” through “The Key”)
1/28 Persepolis 103-134 (“The Wine” through “Kim Wilde”)
1/30 Writer/Designer chapter 2
2/1 Due: Sunday Funnies 3

I hope you’ve all had a great weekend. The coming week will be our first “normal” one, since we had no Monday classes in the first two. We’ll spend some significant time discussing chunks of Persepolis this week and get into what will be our fairly regular rhythm: Mondays and Wednesdays focused on reading, analysis, discussion and Fridays focused on your own writings.

On Friday, we will actually spend some time discussing the first two chapters of Writer/Designer. Cheryl Ball, one of the authors of that book, will be on campus next week on Thursday and Friday (2/5 & 2/6) leading discussion and workshops for faculty and grad students around designing and assessing multimodal assignments. She’ll also give a public lecture on Thursday evening, starting at 6:00pm in the Jones Room on the 3rd floor of the library, entitled “The Asymptotic Relationship Between Digital Humanities and Computers and Writing.” I’ll offer extra credit to anyone who attends the lecture and then writes a paragraph or two on your blog about the event–summarize what she spoke about, what you learned, anything you found interesting about the talk. Ball is a very dynamic and fun speaker, and that title is meant to be at least a little bit puzzling and provocative, so you should consider attending if you can.

(Speaking of looking ahead and extra credit. You might want to mark your calendars now for another event: British Poet Laureate Carol Anne Duffy will be giving a reading in Glenn Auditorium at Emory on February 21 at 4:00pm. I’ll offer extra credit if you attend and reflect upon her reading too.)

I’ve been really enjoying your triptychs this week! We’ll talk briefly about them in class tomorrow, so please take a few moments to scroll through your classmates’ photographic comics–and leave comments in response.

I believe almost everybody’s eng101 subdomains are now linked from the Student Work page and are syndicating. The syndication plugin checks for updates about every hour, so if you post something on your subdomain and it’s not showing up after a couple of hours or so, let me know, please. If you’re running into troubles with creating those posts or with configuring your sites, besides just finding time to work on it, then let me know.

By the way, if you’ve been just pasting URLs into your blog posts so far, then it’s time now to start learning how to create links instead. It’s not terribly complicated, but using links is a fundamental web literacy that you need to know how to do. (I’m not going to force you to learn the manual HTML for using links in comments, even though it wouldn’t be a bad idea for you to do so. I am going to require that you use links instead of URLs in your posts and pages.)

Note that for your next Sunday Funnies assignment, you might need to plan ahead a bit because you’ll be turning one set of class notes into a set of drawings or visualizations. These do not need to be polished or elaborate, but you’ll need to make sure to take good notes in one class (besides mine) this week and if you’re going to hand draw your visualizations (which is perfectly fine), you’ll need to build in enough time to go scan your drawings to insert into a post.

(image credit:”3 Mosaic” by Flickr user Leo Reynolds)

Housekeeping

A cartoon diagram of the steps for jarring potatoes which looks like it's from the 1950s. There's a stereotypical pair of women in aprons, moving through the steps and a diagram of the necessary implements at the bottom.

One thing I want you to do:

  • I talked in class today about this system where my post will be “pinged” when you link to it. In order for that to work, you need to turn notifications on in the settings of your dashboard (at least for your subdomain). Go to Settings > Discussion and the first check box, which is probably unchecked, says “Attempt to notify any blogs linked to from the article.” Check that box, then save your settings.

And a couple of things I want to explain to you, just so you know.

  • I changed up the format of Student Posts. The widget this theme uses to generate that grid wasn’t pulling featured images the way I want it to and it is not really designed to handle multiple authors. I might come back to it later and hack the theme’s code to get it to add in a user field, but for right now I don’t think it’s worth that time and it’s too confusing to have the grid showing all your work without names attached to them. So, for now, student posts show up in a category page–which makes things easier on you because now you just need to make sure that every one of your posts includes an image someplace, without necessarily needing that image to be a featured image.
  • I’ve added a tag cloud to the sidebar on some of the pages on my site. Tags in the cloud are bigger if they’ve been applied to more posts, so the size of a tag gives you a sense of how frequently it’s been used. When your posts are syndicated, any categories or tags that you apply to your posts are (supposed to be) turned into tags on my site. If you add tags to your posts, then, they’ll show up in the tag cloud and readers can use those to sort. So if you add the tag “A Softer World” to your posts someone can click on the tag to see all the syndicated posts with that in common (capitalization doesn’t matter, but spacing does, so “ASofterWorld” will show up as a separate tag). How many posts will include fart jokes by the end of the semester? Do we even want to know?


(image credit: “Housekeeping” by Flickr user Fabian Mohr.)

1 3 4 5 6 7